Data Visualization
This work utilizes my custom font design, “DNA Strands”, to represent DNA sequences of endangered and extinct species.
This large-format diagram represents an innovative method of visualizing family relationships in addition to individual lifespans.
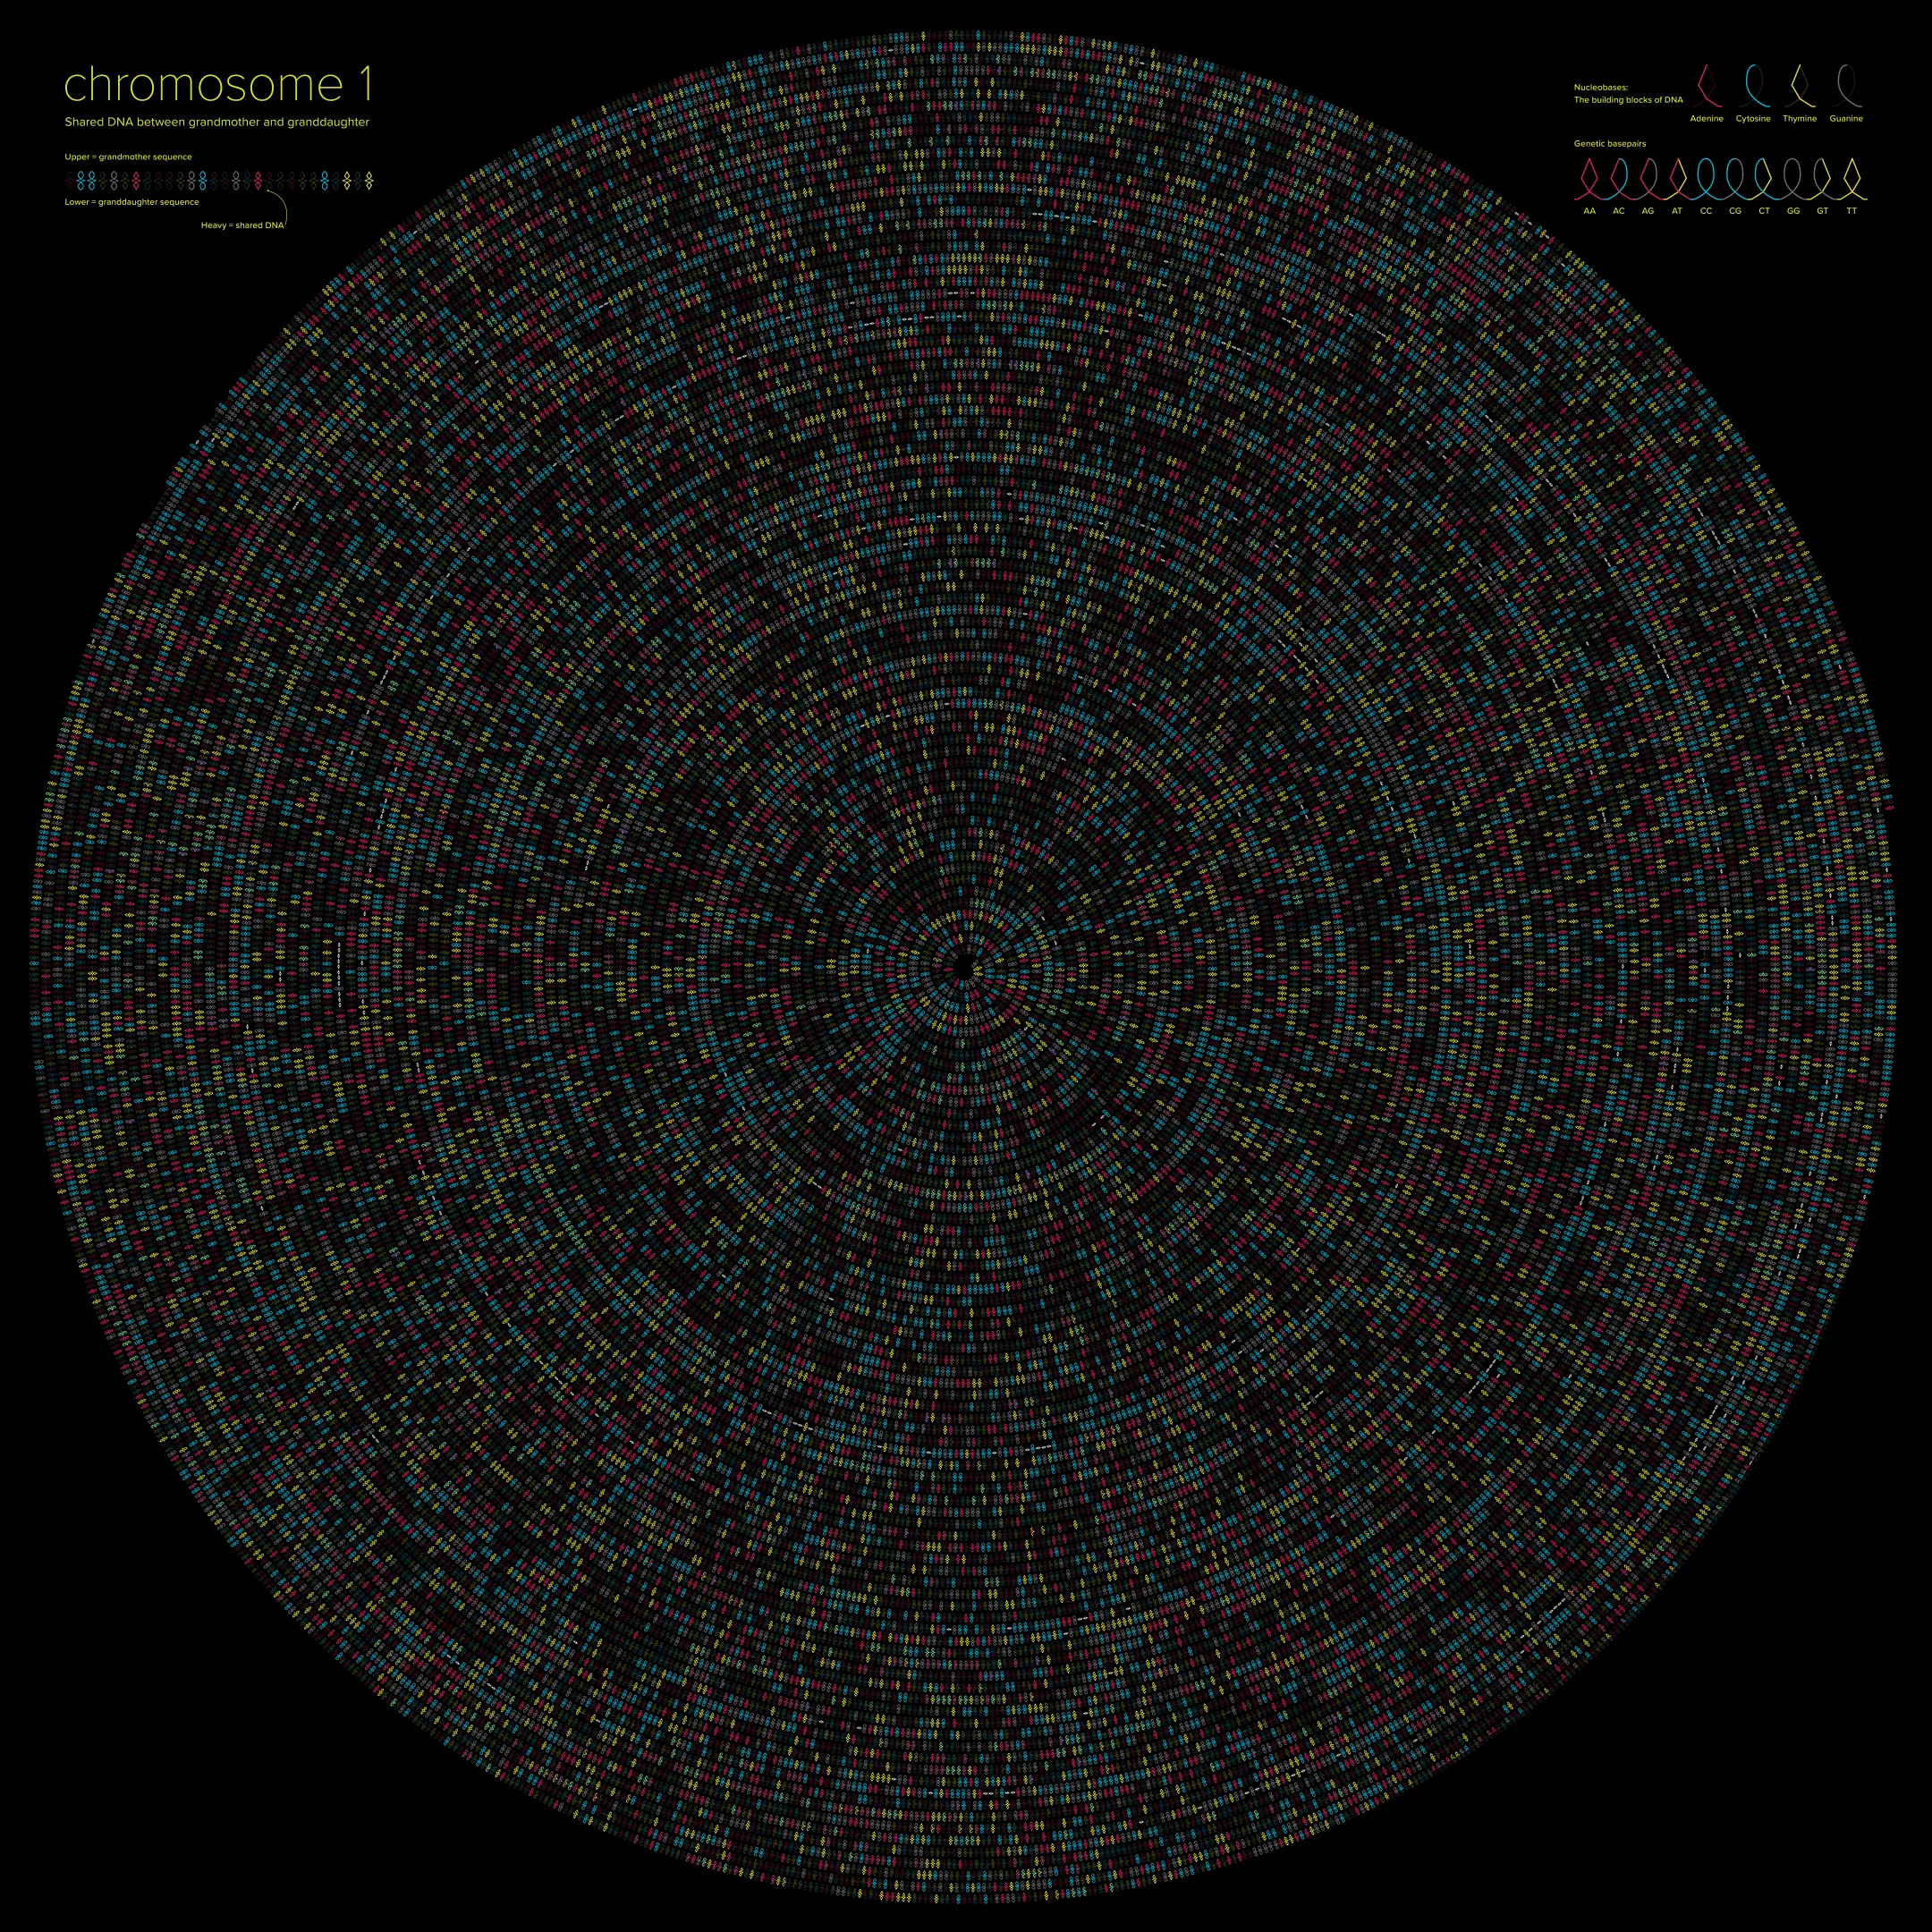
This creative information display makes visual comparisons of my own genetic sequence with that of my grandmother.
"DNA Loops" is custom Color SVG Font which allows a user to translate DNA Basepairs into ligature symbols. This font can be utilized to create custom visual comparisons of DNA sequences between individuals.
This infographic traces the movements of individual artists as they arrived and departed the city of Greenville, North Carolina over the course of several years.
This infographic describes the history of controversial placenames. What are the implications of altering historic placenames for the sake of political correctness?


